Introduction
DataRay has always been committed to providing accurate and reliable solutions for characterizing a wide range of laser beams. We take pride in listening to customer requests and working to expand our product line to meet their needs. DataRay is happy to announce our new Line Laser Profiling System (LLPS) with the capability to provide direct measurements of line lasers up to 200 mm in length and down to 55 microns in thickness.
Overview
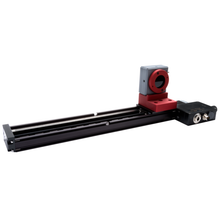
The Line Laser Profiling System uses the full-featured free DataRay software to automatically move our flagship WinCamD-LCM beam profiling camera across the length of the line laser output using our M2DU-200 linear stage. The software will calculate the ideal exposure time for the scan, then automatically complete a full scan to capture and analyze the line laser output. A full image of the line laser intensity distribution will be shown along with a vertical centroid plot, line width plot, intensity plots, and several other useful metrics. The Line Laser Profiling System is enabled in software versions 8.0B16 and later.

Software Features
The Line Laser Profiling System Dialog provides access to the new line laser measurement capabilities of the free DataRay software. The dialog is shown in Figure 2 and demonstrates the interface to perform scans and record line laser measurements.
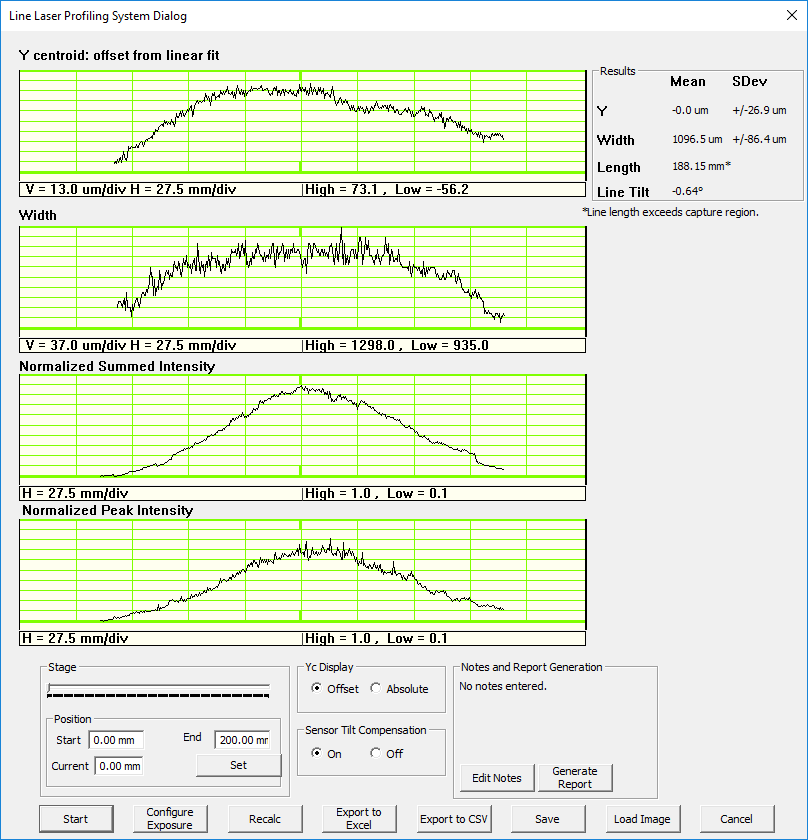
Results
The Results box displays statistics for the Y centroids, width (thickness) of the line, length of the line, and tilt of the line.
Y Centroid Plot
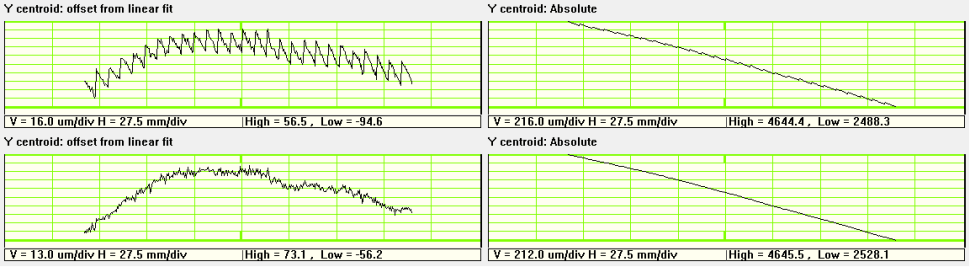
The Y Centroid plot displays the Y-position centroid for each column against its X-position. This plot may be displayed as absolute data or as an offset from a linear fit.
Width Plot
The Width Plot plots the width (thickness) of the line laser along the axis of camera movement, measured in accordance with the chosen clip width level.
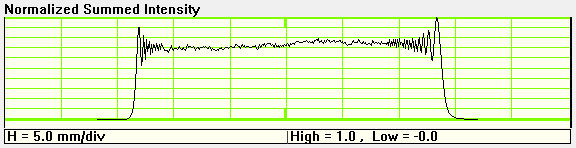
Normalized Summed Intensity
This plots the normalized sum of the pixel intensities in each column against X position.
Normalized Peak Intensity
This plots the normalized peak value of the pixel intensities in each column against X position.
Data Output
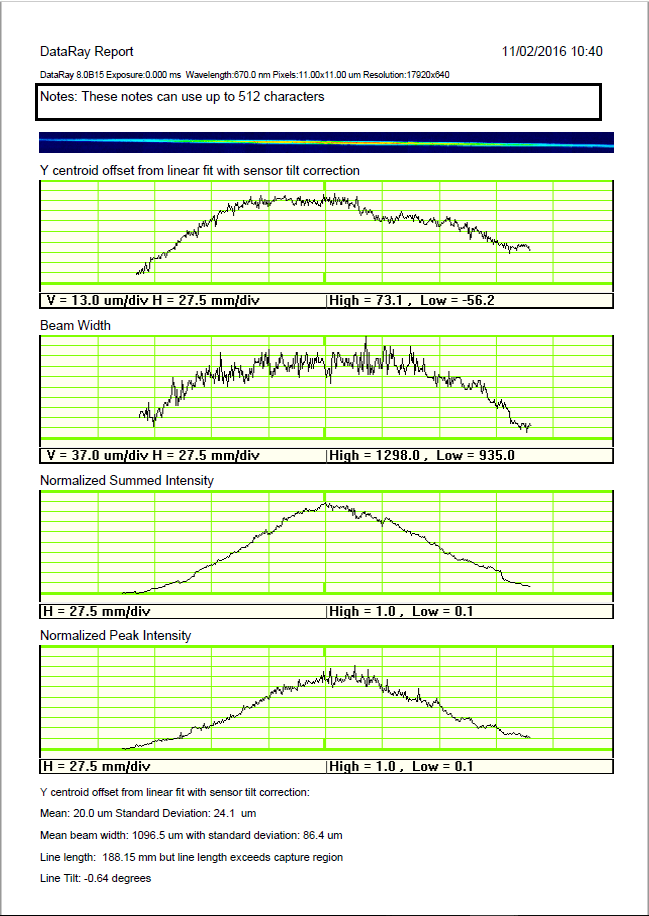
The Line Laser Profiling System Dialog includes several options to save and export data. The built-in PDF report generator outputs a concise summary of the data including the four plots, an image of the intensity distribution, and custom notes. Export to Excel will export the raw data from each plot to an Excel document, and the Export to CSV option will export this raw data to a CSV file using Notepad. There is also an option to save a file with all current data that can be reopened later in the DataRay software.
Residual Sensor Tilt Compensation
Due to manufacturing limitations or imprecise custom mounting, there is a possibility of slight roll of the sensor along the optical axis. In most cases this effect will not be noticeable, but even just a few milliradians of sensor tilt may cause a “zigzag” effect in the intensity distribution. An exaggerated diagram demonstrating the effect as the sensor moves across the stage is shown below in Figure 5.
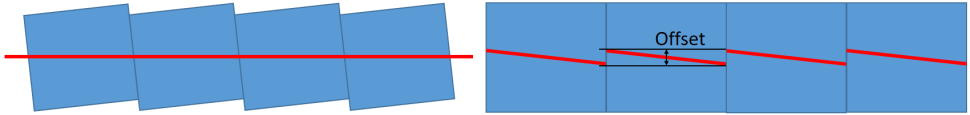
The DataRay software can optionally remove this effect without affecting the overall tilt measurement of the entire line.
Conclusion
Line lasers that are too long to be measured on a single stationary sensor can still be directly measured using DataRay’s Line Laser Profiling System. The full-featured free software provides simple and powerful controls for the measurement and analysis of line lasers. Should you have any questions about any of our beam profiling products, please contact us at [email protected]. We have years of experience in the field of laser beam profiling and look forward to finding a solution for your system.
Author: Loren Jones
Products Mentioned
Line Laser Profiling System
- Analyze line lasers up to 200 mm in length
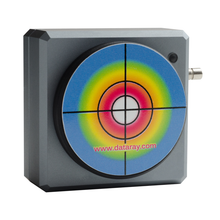
WinCamD-LCM
- Versatile global shutter supports CW & pulsed beams
- 355 to 1150 nm standard with UV, 1310 nm, and 1550 nm options
Related News
Large Beam Profiling System
Specialized Beam Profiling Systems | July 7, 2016
Although most laser beams can be imaged directly onto an image sensor, occasionally our customers need to measure beams which require a larger sensor area. For beams too large for traditional approaches, DataRay is pleased to announce our new Large Beam Measurement System (LBMS). Read on to learn more!