
M² Measurement & Analysis
What is M²?
M squared (M² or M2), or beam quality factor, is a dimensionless parameter that characterizes the degree of imperfection of a real-world laser beam. The lower the value of M², the more tightly the beam can be focused to a small spot. A theoretical perfect TEM\(_{00}\) beam has an M² value of 1. In reality, however, no laser beam is perfect; limitations of the laser cavity, the lasing medium, optical train shortcomings, etc., mean that real-world beams are not the diffraction-limited, Gaussian profile, pure TEM\(_{00}\) mode described in textbooks. Complex beams contain multiple mode contributions that increase M². Even a "good" laboratory HeNe laser has an M² of around 1.05 to 1.2.
The Effect of M² on Focused Spot Size
M² is the ratio between a given laser beam's beam parameter product and that of a perfect Gaussian beam at the same wavelength. Specifically, it is defined as \begin{equation} M^{2} = \left( \frac{\pi}{4 \lambda} \right) \times d_{0} \times \theta \end{equation} where \(d_{0}\) is the beam waist diameter and \(\theta\) is the full far-field divergence angle.
For a given focusing optic, the minimum achievable spot diameter scales directly with M². A beam with M² = 2 focuses to twice the diameter, and therefore one quarter the peak intensity, of a diffraction-limited beam through the same lens. In materials processing applications, this difference in peak intensity can determine whether a given process threshold is reached.
Measuring M² per ISO 11146
ISO-compliant M² cannot be determined from a measurement at a single plane. It is derived from the way the beam diameter changes as the beam propagates, so the measurement is fundamentally a series of beam diameter measurements taken along the propagation axis.
The ISO 11146 Procedure
- Focus the beam with a high-quality lens of known focal length to create an accessible beam waist.
- Measure the beam diameter at a minimum of ten Z-positions. ISO 11146 requires that at least five lie within one Rayleigh range of the waist, and at least five lie beyond two Rayleigh ranges from it.
- Use the second moment diameter at every position. This requirement is discussed below.
- Fit a hyperbola to beam diameter against Z-position: \(d^{2}\)\((z)\) \(=\) \(a\) + \(bz\) + \(cz^{2}\)
- Derive M² from the fit coefficients, along with the waist diameter, waist location, divergence, and Rayleigh range.
The sampling requirement exists because the hyperbolic fit must be constrained at both ends. Positions clustered near the waist define the minimum diameter but not the divergence, while positions taken only in the far field define the divergence but not the waist. When both regions are sampled, the hyperbola is well-determined. When only one is sampled, the fit remains underconstrained and the resulting M² value carries no useful accuracy.
Why the Beam Diameter Definition Matters
ISO 11146 specifies the second moment diameter for the calculation of M². This is the only beam diameter definition for which the hyperbolic propagation law holds exactly for arbitrary beam shapes.
Other beam diameter definitions, including the D86 power enclosure method and the clip level method commonly used with scanning slit devices, are legitimate beam diameter measurements and are often more repeatable in practice. However, they do not propagate hyperbolically for higher-order beams. An M² value calculated from them is not ISO 11146 compliant and will disagree with a second moment result, in some cases substantially. For this reason, DataRay beam profiling software offers the D86 method to measure beam diameter but does not offer an option to calculate M² from it.
A detailed comparison of these methods, including measured results for a TEM\(_{00}\) Gaussian and a TEM\(_{20}\) Laguerre-Gaussian beam, is given in When to Use the D86 Beam Width Measurement Method.
Common Sources of M² Measurement Error
Baseline offset and noise in the beam wings. The second moment weights intensity by the square of the distance from the centroid, so light far from the beam center contributes disproportionately to the calculated diameter. A small uncorrected baseline offset arising from sensor dark current, ambient light, or scatter will inflate the measured diameter significantly. This is the most common cause of erroneously high M² values. In the DataRay Beam Profiling Software, HyperCal is a type of background subtraction technique to remove unwanted fixed pattern and thermal noise from measurements which can help address this issue. It takes a rolling average of periodic 'zero-exposure' frames and subtracts it from the live image.
Insufficient z-axis sampling. Restricting the measurement to positions near the waist leaves the divergence term unconstrained, and the calculated M² tends toward 1 regardless of the actual beam quality. Additionally, ten (10) z-positions is the minimum specified by ISO 11146 rather than a recommended target. Additional positions improve confidence in the fit, and the fit residuals indicate whether the beam follows the expected propagation law.
Beam clipping. If the beam overfills the detector the wings are truncated and the measured diameter is underestimated. The resulting M² is artificially low. This condition should be verified at the largest beam diameter in the scan rather than at the waist.
Focusing optic quality. Aberrations introduced by the focusing lens contribute to the measured M². The resulting value characterizes the combination of the beam and the focusing optic. A well-corrected lens appropriate to the wavelength and f-number should be used.
For a detailed treatment of the systematic error inherent to beam diameter measurement under ISO 11146, see Systematic Error in ISO 11146 Measurements. The practical limits on measuring very small beams are covered in Small Beam Width Theoretical and Experimental Error.
Choosing a Measurement Approach
Camera-based profiling records the full two-dimensional intensity distribution at each Z-position. This is significant for structured, multi-mode, or asymmetric beams, where a one-dimensional measurement can be misleading. The beam must fit within the sensor active area, appropriate attenuation is required for the incident power level, and spatial resolution is limited by the pixel pitch.
Scanning slit profiling provides wide dynamic range and accommodates very small beams and higher power densities. Because the measurement integrates along one axis, it is best suited to beams that are well behaved in profile.
Multi-plane scanning slit profiling measures at several Z planes (but fewer than 10) without using a translation stage and produces an M² value in real time, albeith ISO-noncompliant with lower absolute accuracy than a full ISO 11146 scan. This approach is appropriate during optimization work, such as cavity adjustment, optical alignment, or process tuning, where immediate feedback is more useful than an ISO-compliant absolute measurement.
Single-plane profiling on a translation stage is the configuration used for absolute ISO 11146 compliant measurement, with automated acquisition and fitting performed in the DataRay software.
Frequently Asked Questions About M²
What is a good M² value? This depends on the laser and the application. A well-behaved HeNe laser sits around 1.05 to 1.2, and single-mode fiber lasers typically fall below 1.1. High-power multimode fiber and diode-pumped solid-state lasers range from approximately 2 to well above 10. Diode bars are frequently asymmetric, with substantially different M² values in the fast and slow axes. A higher value is not automatically worse; many welding and heat-treating processes benefit from a larger, more uniform spot (and thus a higher M² value).
Can M² be less than 1? No. M² = 1 is the diffraction limit. A measured value below 1 indicates a measurement error, most commonly beam clipping or excessive background subtraction.
Do I need to measure M² in both axes? Yes, for any beam that is not circularly symmetric. ISO 11146 treats the orthogonal axes separately, and asymmetric sources such as diode bars can differ by an order of magnitude between them.
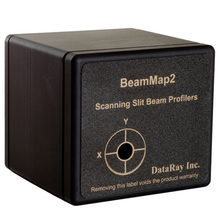
How long does an M² measurement take? An automated ISO-compliant M² measurement with an M2DU stage in the DataRay beam profiling software typically takes 1-2 minutes. A real-time M² measurement with a BeamMap2 is effectively instantaneous, making it ideally suited to optimization work.
How large/small a beam can be measured? The Beam'R2 directly profiles beams as small as 2 µm. For beam profiling cameras, the minimum recommended spot diameter is 10x the camera pixel size. Even smaller beams can be measured through refocusing or magnification. Lens selection is also a factor. For large collimated beams, Rayleigh length is a consideration. Contact us for more information.
Is M² sufficient to characterize a beam? Frequently it is not. M² is a single parameter describing propagation, and two beams with identical M² values can have very different intensity distributions. Where spot uniformity is the concern, flat-top and plateau uniformity metrics should be considered alongside M². Where wavefront aberration is the concern, a Shack-Hartmann wavefront sensor measures the wavefront curvature and optical aberrations directly.
Best Products for ISO 11146 Compliant M² Measurement
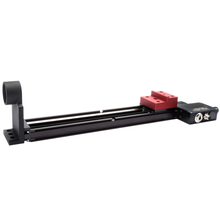
DataRay offers a wide variety of beam profilers that can measure M². These include beam profiling cameras and the Beam'R2 when mounted on an M2DU translation stage, with automated M² measurements in the DataRay software.
The full-featured DataRay software also supports manual M² measurements when any of our instruments are mounted on a third-party translation stage, with the user entering the sequential stage positions.
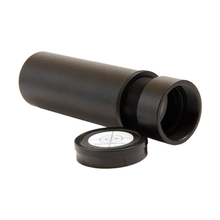
For beams that are not already focused to a measurable size with sufficient working distance, measuring M² on a translation stage may necessitate an appropriate lens assembly.
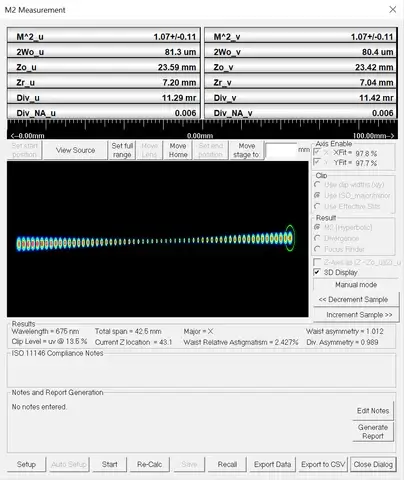
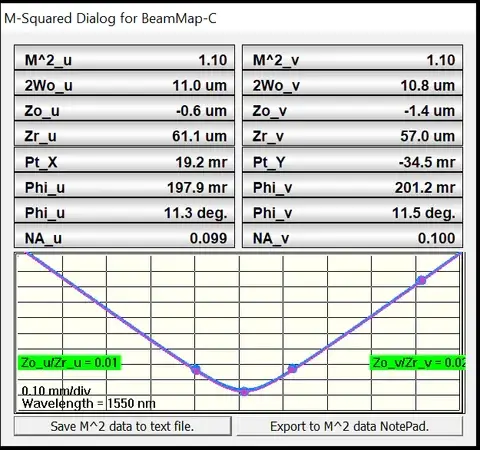
Additionally, ISO-noncompliant M² measurements (with lower absolute accuracy) can be made in real-time using the BeamMap2 multiple Z plane scanning slit beam profiler. This can be a great option for quick M² optimization.
Optimal Lens Selection
Use this Excel spreadsheet to model your M² measurement and help ensure you choose the correct lens assembly.
If you’re unsure which product is most suitable for your application or have the need for something custom, please contact us.
Have questions or need help identifying the right solution for your application?

Related Products
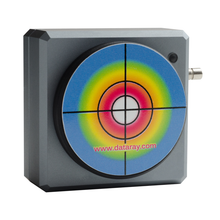
WinCamD-LCM
- Versatile global shutter supports CW & pulsed beams
- 355 to 1150 nm standard with UV, 1310 nm, and 1550 nm options
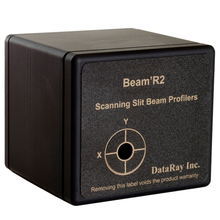
Beam'R2
- Affordable single-plane beam profiling
- Directly profile beams as small as 2 µm
BeamMap2
- Robust, multi-plane beam profiling
- Real-time M², divergence, pointing, and focal measurements

ISO 9001 Certified Company

Products Designed & Manufactured in the USA
